Introduction
Inventory decisions sit at the centre of operational performance. If a business holds too much stock, cash gets locked up, storage costs rise, and items may expire or become obsolete. If it holds too little, it risks stockouts, lost sales, and lower customer trust. The difficulty is that demand is rarely perfectly predictable. Most real supply chains face variability in daily sales, seasonal swings, and sudden spikes caused by promotions or external events. Inventory optimisation models help organisations make consistent decisions under this uncertainty. For learners building practical skills through a data analytics course, these models are a strong example of how analytics converts messy business problems into repeatable calculations.
This article explains how to calculate two core inventory controls under stochastic demand: safety stock and reorder points. It also outlines the assumptions behind the formulas and how to adapt them for real operations.
Understanding Stochastic Demand and Lead Time
Stochastic demand means demand varies randomly around an average. Instead of a single fixed number, you work with a distribution described by a mean and a measure of spread such as standard deviation. Inventory models often assume demand is approximately normal over short horizons, not because it is always normal, but because it gives a workable approximation and supports standard service-level calculations.
Lead time is the time between placing an order and receiving it. Lead time can also vary, but many baseline models start with constant lead time and later extend to variable lead time. The key idea is that reorder planning must cover demand during lead time, because that is the period when you cannot replenish instantly.
Safety Stock: The Buffer Against Variability
Safety stock is extra inventory held to protect against uncertainty. Conceptually, it exists to absorb variability in demand (and sometimes lead time) so that you can maintain a target service level.
Service level and the Z-score
A common approach links safety stock to a target cycle service level, which is the probability of not stocking out during a replenishment cycle. If demand during lead time is assumed normal, safety stock is computed using a Z-score:
Safety Stock = Z × σ<sub>L</sub>
Where:
- Z is the standard normal value for the desired service level (for example, 1.65 for ~95% cycle service level).
- σ<sub>L</sub> is the standard deviation of demand during lead time.
Estimating demand variability during lead time
If lead time is constant at L days and daily demand has standard deviation σ<sub>d</sub>, then:
σ<sub>L</sub> = σ<sub>d</sub> × √L
This scaling is important. Variability grows with the square root of time, not linearly, assuming day-to-day demand is independent. In practice, if demand is strongly seasonal or correlated, you may need to estimate σ<sub>L</sub> directly from historical lead-time windows rather than relying on the square-root rule.
For learners in a data analyst course in Pune, this is a great place to practise: extract daily demand, compute mean and standard deviation, test for seasonality, and compare model-based σ<sub>L</sub> with empirical σ<sub>L</sub>.
Reorder Point: When to Place the Next Order
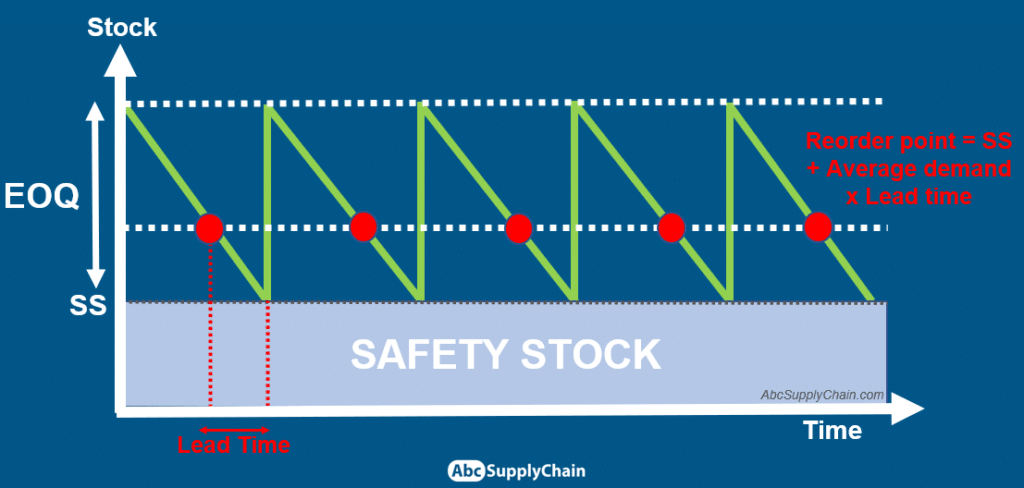
The reorder point (ROP) is the inventory position at which you trigger replenishment. The standard formula is:
Reorder Point = Average Demand During Lead Time + Safety Stock
If daily demand mean is μ<sub>d</sub> and lead time is L days:
Average Demand During Lead Time = μ<sub>d</sub> × L
So:
ROP = (μ<sub>d</sub> × L) + (Z × σ<sub>d</sub> × √L)
This simple structure is powerful because it separates the predictable part (mean demand over lead time) from the uncertainty buffer (safety stock). Operationally, many systems track inventory position (on-hand + on-order − backorders) and place an order when inventory position drops to the reorder point.
Choosing the Right Service Level
A high service level reduces stockouts but increases inventory. A lower service level does the opposite. The correct choice depends on the cost trade-off:
- Stockout cost: lost margin, penalties, customer churn, expediting costs
- Holding cost: warehousing, insurance, spoilage, opportunity cost of capital
Many teams start with broad service-level tiers based on item importance, such as:
- A-items (high value/critical): 95–99%
- B-items: 90–95%
- C-items: 80–90%
Analytics helps refine this by estimating holding cost per unit per period, measuring stockout impact, and tuning Z accordingly. This is where a data analytics course becomes directly applicable: service levels are not just theoretical targets, they are business decisions supported by data.
Practical Considerations and Common Pitfalls
Even good formulas can fail if inputs are poor. Common issues include:
- Using outdated demand history: demand patterns shift; use rolling windows and seasonal adjustments.
- Ignoring promotions and events: separate baseline demand from uplift; otherwise σ becomes inflated.
- Assuming constant lead time when it is variable: if lead time varies significantly, incorporate lead-time variance into σ<sub>L</sub>.
- Not segmenting SKUs: items behave differently; apply ABC analysis or demand classification (smooth, intermittent, lumpy).
- Confusing cycle service level with fill rate: cycle service level measures stockout probability per cycle, while fill rate measures the fraction of demand filled immediately. They lead to different safety stock levels.
Conclusion
Inventory optimisation under stochastic demand is about balancing service reliability with inventory cost. Safety stock provides a buffer against variability, while the reorder point defines a clear trigger for replenishment based on expected demand during lead time plus that buffer. With the right demand and lead-time estimates, these models support consistent, transparent decisions across thousands of SKUs. For professionals learning through a data analyst course in Pune or strengthening operational analytics via a data analytics course, mastering these calculations builds a solid foundation for supply chain dashboards, forecasting workflows, and inventory policy improvement initiatives.
Contact Us:
Business Name: Elevate Data Analytics
Address: Office no 403, 4th floor, B-block, East Court Phoenix Market City, opposite GIGA SPACE IT PARK, Clover Park, Viman Nagar, Pune, Maharashtra 411014
Phone No.:095131 73277